Precision, Recall, IoU, Average Precision
Posted on January 22, 2020
Evaluation Method in Recognition or Detection

In this post, We learn evauation sikills like
TP,TN,FP,FN
Precision
Recall
IoU
PR Curve(Precision-Recall curve)
AP(Average Precision)
* TP, TN, FP, FN
In Evaluation, Threre are four caseses like below.
Ground True
|
Predict Result
| |
Positive
|
Negative
| |
Positive
|
TP(true positive)
|
FN(true negative)
|
Negative
|
FP(false positive)
|
TN(false negative)
|
Then,
True is box coordinate cover a face.
False is box coordinate which is not cover a face.
Positive is the Predict Result box cover a face
Negative is the Predict Result box is not cover a face
But this situation is not explain the caseses like below.
TP: when image include face, predict result box cover the face.
TN: when image include face, threre is no predict result box
FP: when image not include face, predict result box find face(exactly that's not a face).
FN: when image not in clude face, threre is no predict result box
* Precision, Recall
Easily, you guess TP is good result and FP is bad result
but it's not a good with just using only this.
So there are good preformance indicators using those.


In my opinion,
Precision is like 'how good detection it is'
Recall is like 'how bad detection it is'
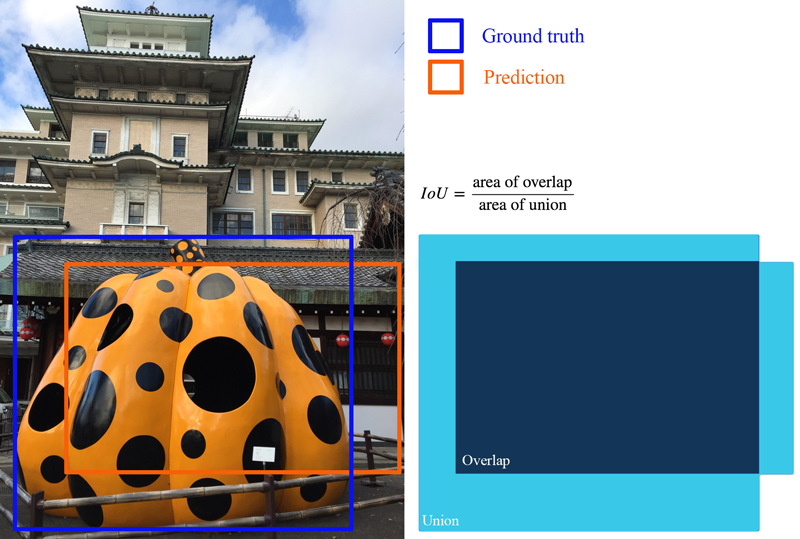
* IoU
IoU (Intersection over union) measures the overlap between 2 boundaries.
We use that to measure how much our predicted boundary overlaps with the ground truth (the real object boundary).
In some datasets, we predefine an IoU threshold (say 0.5) in classifying whether the prediction is a true positive or a false positive.
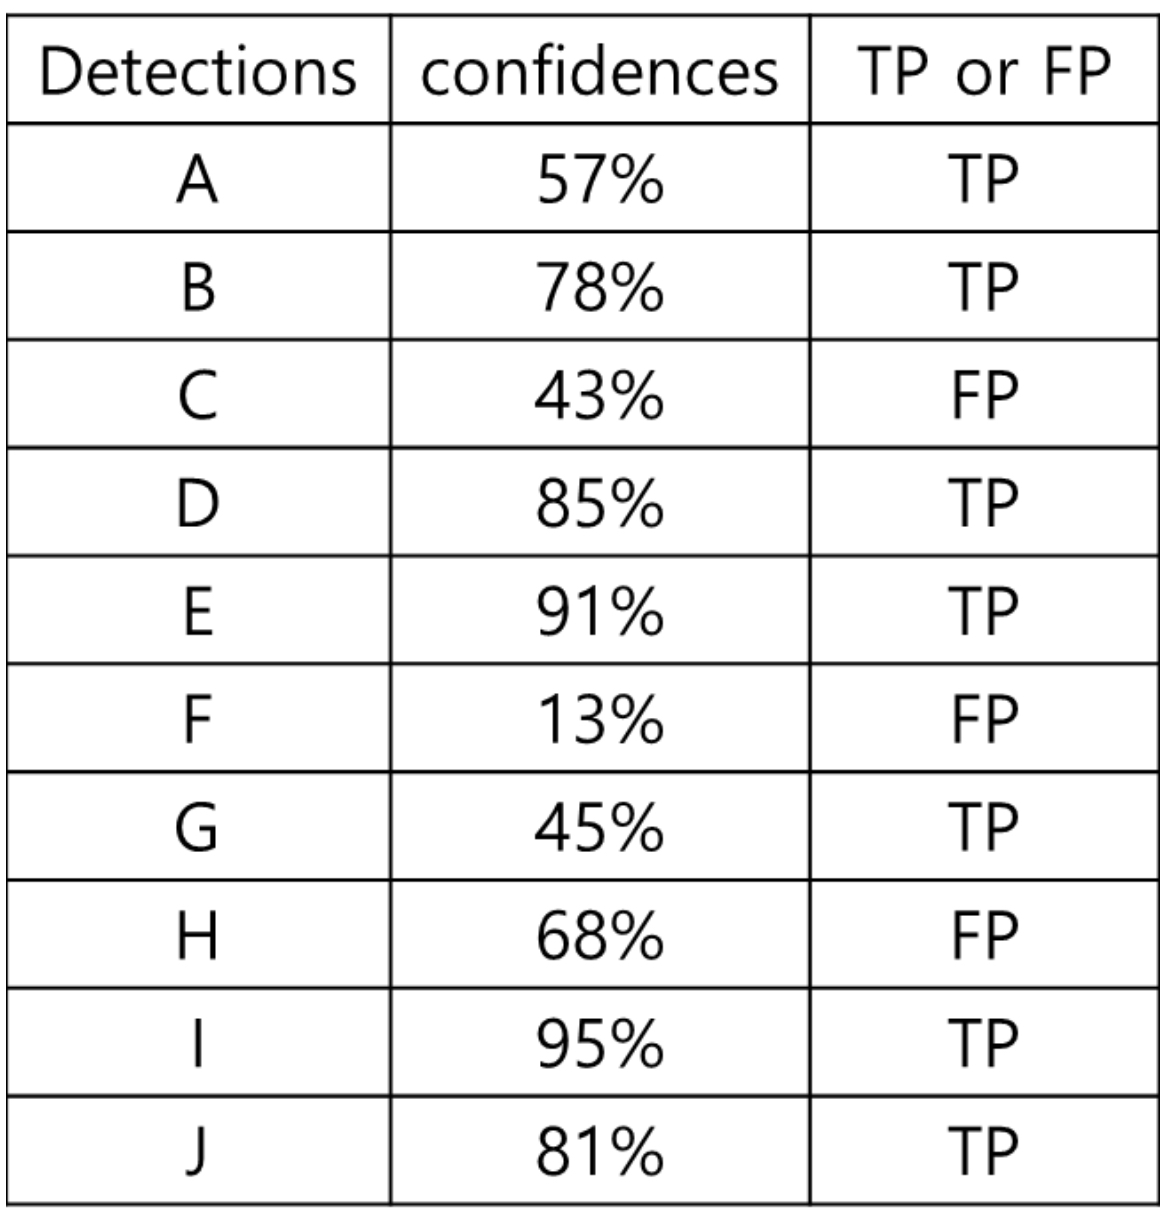
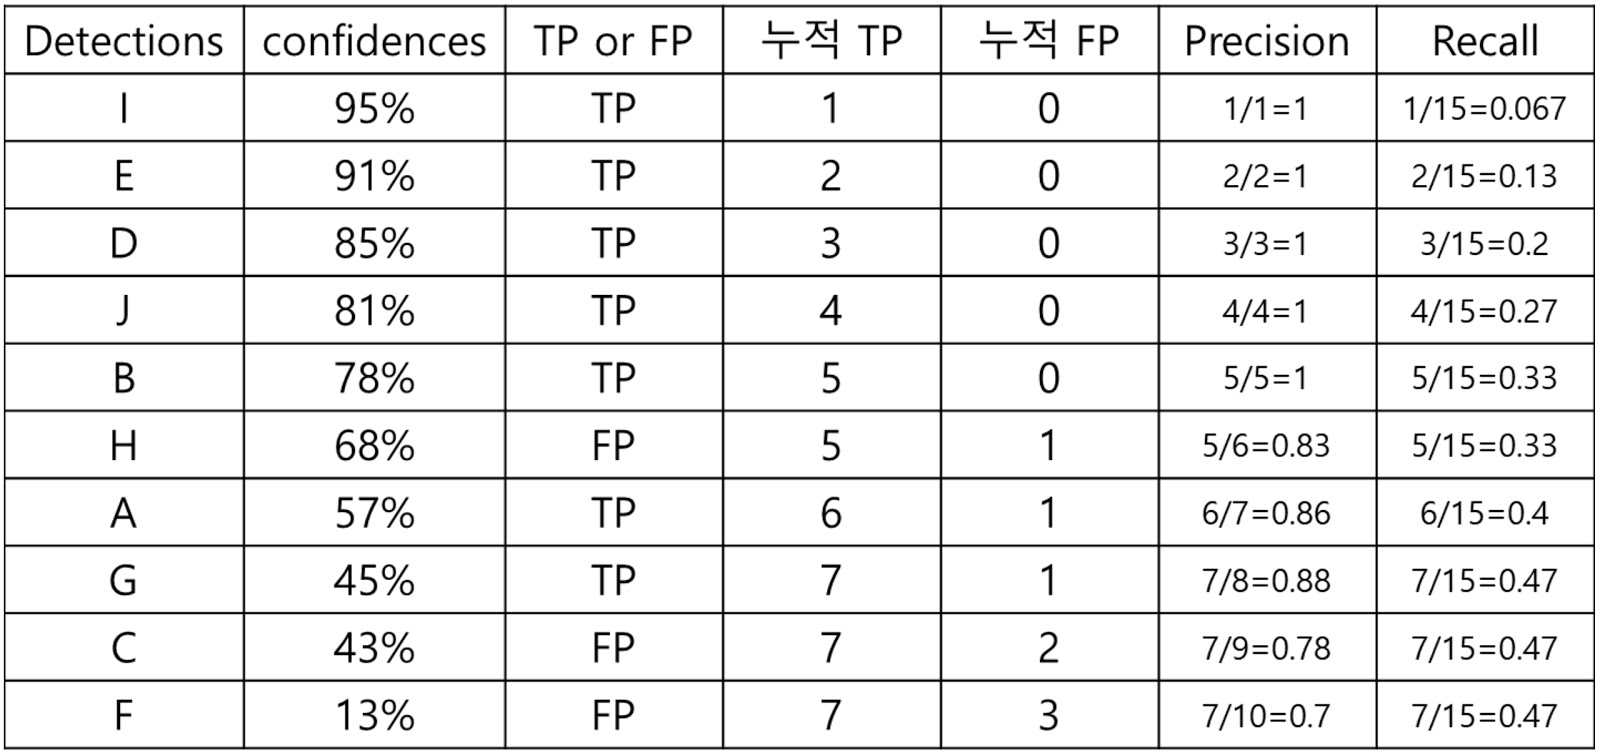
* Precision-Recall Curve Assume that Predict Result like below. and all faces is 15

* AP
AP(average Precision) is number that represent precision-recall curve
AP value calculate the area of under PR curve like below

As you can see, Area Boundary is not exactly same with PR curve for calculating
*mAP : mean AP , if detection objects is more than one, each AP value's mean is mAP*
Reference